Metrolink Personal Impact Calculator: emissions and fuel savings
I led the UI/UX design and created custom formulas for Metrolink's Personal Impact Calculator, and managed its development with the vendor.
About the project
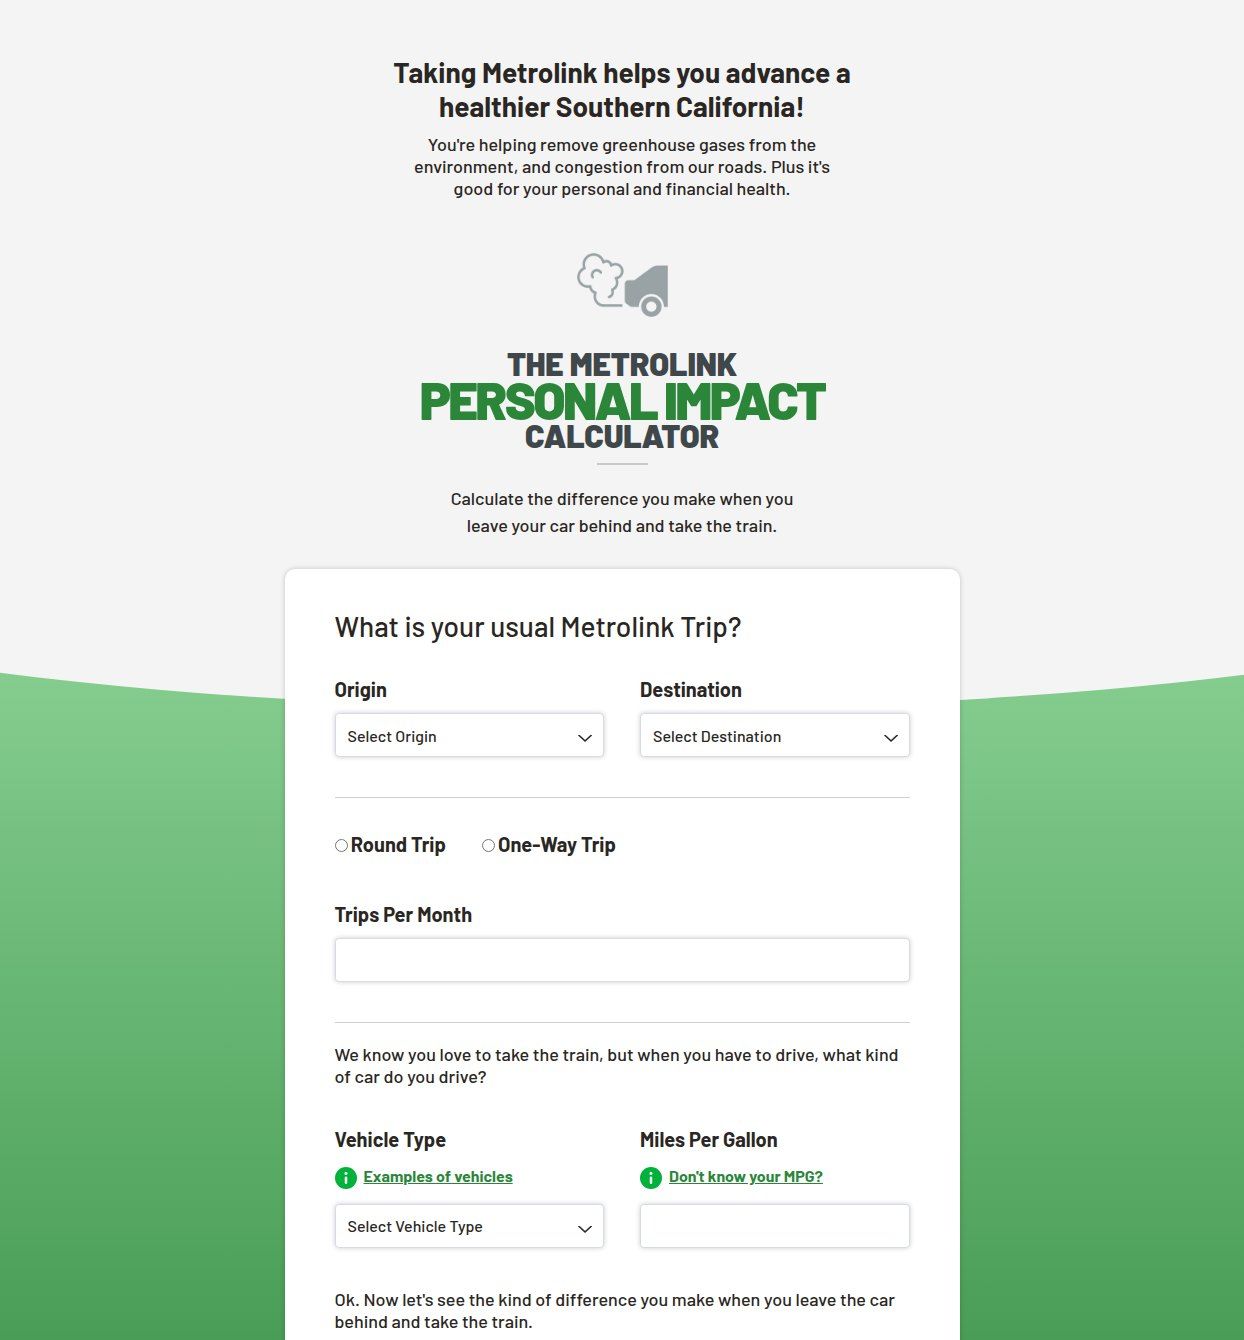
Metrolink's Personal Impact Calculator shows a rider the greenhouse gas emissions avoided, the fuel and driving costs saved, and the driving miles avoided by taking the train instead of driving. The marketing department wanted to show riders what they gain, beyond buzzwords.
What does the Metrolink Personal Impact Calculator do?
It estimates what you save when you take the train instead of driving. You pick two Metrolink stations, a round trip or one way, how often you ride, and the kind of car you would drive. It shows the greenhouse gas emissions avoided, the fuel and driving costs saved, and the driving miles avoided.
My role
Under the direction of Metrolink's marketing department, I worked out how the calculator would work and created the custom formulas behind it. I led the UI/UX design, made mockups, and managed the development with the vendor, Web Advanced, so the build met the requirements.
How it went
What the calculator shows
Metrolink announced the calculator on October 6, 2020, for California Clean Air Day. After a rider enters a usual trip, the calculator shows the emissions avoided in metric tons of carbon dioxide, with equivalents such as gallons of gasoline and smartphones charged. It shows offsets, such as the tree seedlings grown for ten years and the acres of forest in one year. It shows the driving cost and fuel savings, and the stressful driving miles avoided. The page is plain about its limits: driving costs cover fuel, maintenance, repair and tires, the miles are the distance between the two stations, and the savings do not subtract the fare.
The data and the formulas
The idea was to sell Metrolink to riders beyond buzzwords: to show how much they gain by riding instead of driving. We used public data, including AAA’s driving cost study and fuel price, and the U.S. Environmental Protection Agency’s greenhouse gas equivalencies. I created custom formulas that tie those sources to a rider’s own trip, so a person can see how many gallons of gas, how many trees’ worth of emissions and how many dollars they save.
Building it with the vendor
The calculator was highly technical and formula-driven, with a lot of logic behind a simple form. We built it with Metrolink’s vendor, Web Advanced, who helped develop and design it. I led the designs as UI/UX and made sure the build met the requirements and a high spec.
Why time is the point
The numbers cannot count the time a rider gets back. My own commute is over an hour each way, in LA traffic. On the train I do not have to hold a wheel and stay hyper-focused on driving, so I can work, write, sleep or watch a show instead. Part of this portfolio was built in that time.
Need a calculator or a data tool?
I design the interface and the logic behind tools like this one: what to ask, which public data to use, and how to show the result so people act on it. If you want an interactive tool for your site, tell me what it should help people decide.